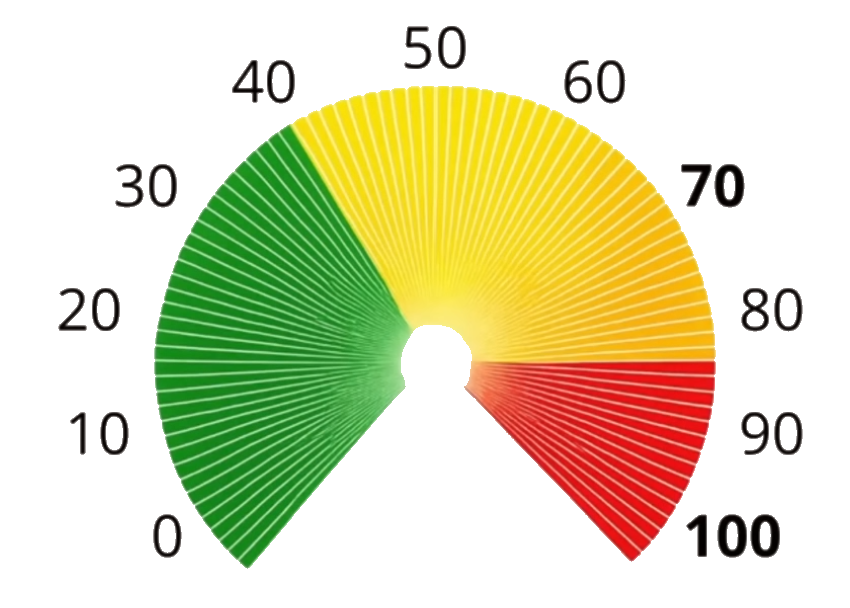
Crisisometer: Global Systemic Risk Indicator
48/100

| # | Macro Indicator | Current | Delta vs Prev. |
| 1 | Difference in UST yield | 0.27 | 0.00 |
| 2 | US Dollar Index - DXY | 100.22 | 0 |
| 3 | VIX Index (S&P 500 Volatility) | 14.81 | -0.63 |
| 4 | Baltic Dry Index (BDI) | 3370 | 34 |
| 5 | Unemployment Claims | 196000 | -10000 |
| 6 | ISM Manufacturing PMI | 54.60 | -1 |
| 7 | Federal Funds Rate | 3.63 | 0 |
| 8 | M2 Monetary Aggregate | 23218 | 102.80 |
| 9 | Fed Balance Sheet (Quantitative Tightening) | 6746548 | 5929 |
| 10 | Reserve balances at the Fed (USD billions) | 3,013.79 | 22.48 |
| 11 | Consumer Confidence | 55.20 | 5.70 |
| 12 | Consumer Price Index (CPI) | 334.13 | 1.32 |
| 13 | US Retail Sales | 773947 | 9485 |
| 14 | ISM Services Business Activity | 61.70 | 2.60 |
| 15 | Unemployment | 4.10 | 0 |
| 16 | Durable Goods Orders (USD millions) | 339392 | 3613 |
| 17 | US Building Permits | 1394 | -39 |
| 18 | SOFR − IORB spread (basis points) | -5 | -2 |
| 19 | High-Yield Bond Spreads (HY Spreads) | 2.70 | 0 |
| 20 | St. Louis Fed Financial Stress Index (version 4) | -0.85 | -0.06 |
| 21 | Loan Officer Survey | 0 | -8.10 |
| 22 | VVIX (Volatility Index) | 87.38 | -0.34 |
| 23 | Primary Dealer Positions (US Treasury bond positions) | 104389 | -11583 |
| 24 | China Credit Impulse | 4.70 | 1.89 |
Note: The service calculates the level of macroeconomic stress in the US economy using 24 key indicators. Each indicator is assigned a weight between 0 and 15 points, depending on its value and contribution to recession risk. The total amount (maximum 100) is a comprehensive assessment of current economic sustainability. The data is collected once a day after publication on official websites and is calculated by artificial intelligence online. The higher the number, the more likely it is that economic problems or growth will slow.